- About
- Future Students
- Academics
Academic Resources
- Current Students
- Athletics
- Alumni / Give
Student Achievement Goals
Student Achievement Goals & Outcomes
True to its mission, Mars Hill University “challenges and equips students to pursue intellectual, spiritual, and personal growth.” The university assesses the extent to which students achieve this growth using the following measures: first-year student retention rates, graduation rates, licensure examination outcomes, and post-graduation career outcomes. For certain measures, such as graduation rates, the University has identified a set of ten peer institutions, all of which share commonalities with us, to benchmark our performance against. In 2020, MHU’s Student Achievement Goals were revised to better reflect institutional priorities.
Retention
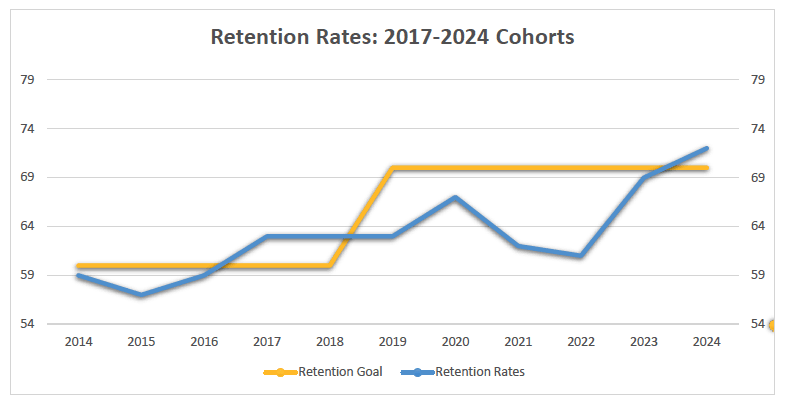
Goal: Retention rate (Fall to Fall) of First-Time, Full-time, First-Year students of 70% or greater
| Reporting Cycle | 2017 | 2018 | 2019 | 2020 | 2021 | 2022 | 2023 | 2014 | 2025 |
| Cohort Year | 2016 | 2017 | 2018 | 2019 | 2020 | 2021 | 2022 | 2023 | 2024 |
| First-Year Retention Rate | 59 | 63 | 63 | 67 | 67 | 62 | 61 | 61 | 74 |
| First-Year Retention Goal | 60 | 60 | 60 | 70 | 70 | 70 | 70 | 70 | 70 |
| First Year Retention Median of MHU Selected Peer Group | 59 | 61 | 63 | 63 | 67 | 69 | 69 | 62 |
Source: IPEDS
Graduation
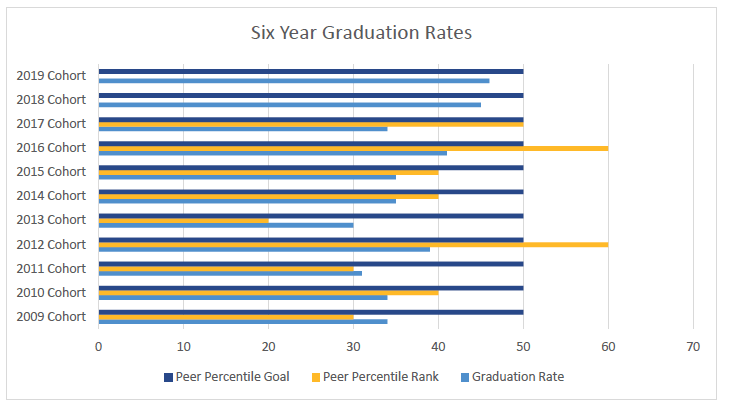
Goal: Graduation rate at or above the 50th percentile comparison group across demographic groups
|
MHU 6-Year Graduation Rates |
|||
| Cohort | IPEDS Reporting Year | Comparison Group Median Graduation Rate | MHU Outcome:
Graduation Rate |
| Fall 2009 | 2015-2016 | 38% | 34%, 30th percentile |
| Fall 2010 | 2016-2017 | 38% | 34%, 40th percentile |
| Fall 2011 | 2017-2018 | 32% | 31%, 30th percentile |
| Fall 2012 | 2018-2019 | 38% | 39%, 60th percentile |
| Fall 2013 | 2019-2020 | 40% | 30%, 20th percentile |
| Fall 2014 | 2020-2021 | 38% | 35%, 40th percentile |
| Fall 2015 | 2021-2022 | 37% | 35%, 40th percentile |
| Fall 2016 | 2022-2023 | 36% | 41%, 60th percentile |
| Fall 2017 | 2023-2024 | 39% | 42%, 60th percentile |
| Fall 2018 | 2024-2025 | 45% | |
| Fall 2019 | 2025-2026 | 46% | |
Source: IPEDS
**Pending data verification.
Licensure Examination Outcomes
Increase student licensure rates in education and nursing
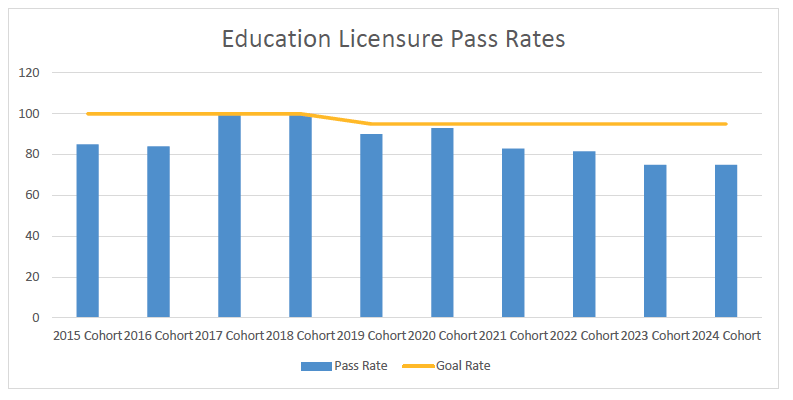
Education
| Academic Year | Achievement Goal | Outcome |
| 2025-2026 (2025 cohort) | 95% or higher pass rate in education licensure exams | |
| 2024-2025 (2024 cohort) | 95% or higher pass rate in education licensure exams | 75% (1 year pass rate) |
| 2023-2024 (2023 Cohort) | 95% or higher pass rate in education licensure exams | 75% (1 year pass rate) |
| 2022-2023 (2022 cohort) | 95% or higher pass rate in education licensure exams | 81.6 (1 year pass rate) |
| 2021-2022 (2021 cohort) | 95% or higher pass rate in education licensure exams | 82.9% (1 year pass rate) |
| 2020-2021 (2020 Cohort) | 95% or higher pass rate in education licensure exams | 93% (1 year pass rate) |
| 2019-2020 (2019 Cohort) | 95% or higher pass rate in education licensure exams | 90% (1 year pass rate) |
| 2018-2019 (2018 Cohort) | 100% | 100% (only 1 year of data available, 1 year pass rate) |
| 2017-2018 (2017 Cohort) | 100% | 100% (only 2 years of data available, 2 year pass rate) |
| 2016-2017 (2016 Cohort) | 100% | 84.21% (3 year pass rate) |
| 2015-2016 (2015 Cohort) | 100% | 85.19% (3 year pass rate) |
Source: Aggregated ETS results as reported to the State of North Carolina via the Title II Federal Reporting process and published in the annual EPP Report Card.
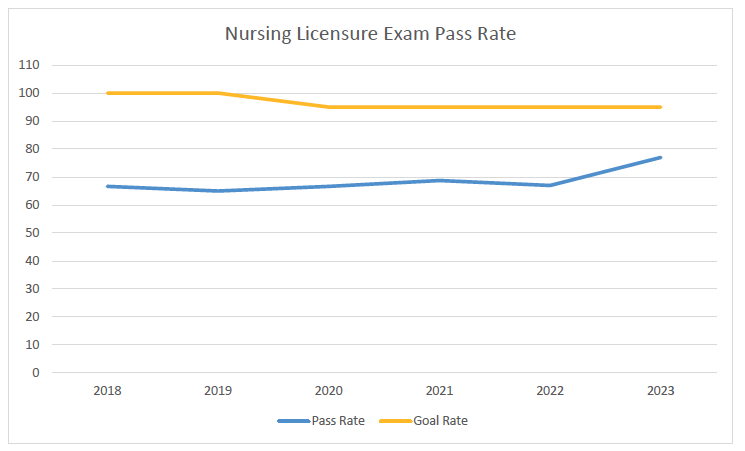
Nursing
| Academic Year | Achievement Goal | Outcome |
| January 1, 2025–December 31, 2025 | NCLEX Registered Nurse pass rate reflecting 95% of a three-year average | 88% |
| January 1, 2024–December 31, 2024 | NCLEX Registered Nurse pass rate reflecting 95% of a three-year average | 77% |
| January 1, 2023–December 31, 2023 | NCLEX Registered Nurse pass rate reflecting 95% of a three-year average | 67% |
| January 1, 2022–December 31, 2022 | NCLEX Registered Nurse pass rate reflecting 95% of a three-year average | 74% |
| January 1, 2021–December 31, 2021 | NCLEX Registered Nurse pass rate reflecting 95% of a three-year average | 68.75% |
| January 1, 2020–December 31, 2020 | NCLEX Registered Nurse pass rate reflecting 95% of a three-year average | 66.67% |
| January 1, 2019–December 31, 2019 | 100% | 65.00% |
| January 1, 2018–December 31, 2018 (first year of test-takers) | 100% | 66.67% |
Source: North Carolina Board of Nursing
Post-Graduation Career Outcomes
Improve student post-graduation career outcomes.
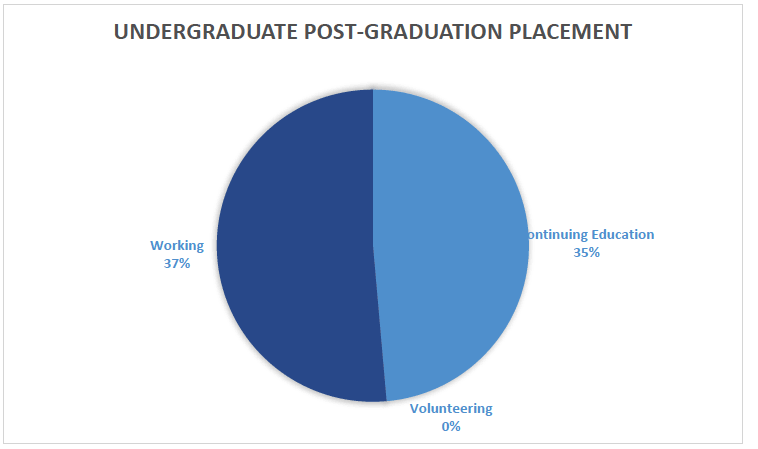
Class of May 2025 Post-Graduation Career Outcomes:
The goal for this metric is 92% Placement rate of undergraduate and graduate students and a 67% Response/knowledge rate.
Undergraduate Placements: 32% of undergraduates who responded to our follow-up report they are employed, enrolled in continuing education, or engaged in volunteer service. Knowledge Rate: 90%
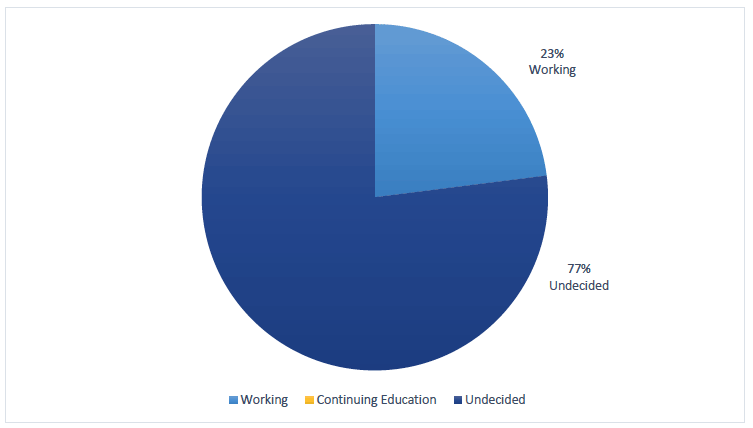
Graduate Placements: 23% of graduate students who responded to our follow-up report they are employed. Knowledge Rate: 50%
Source: Graduation Survey